In Part 1 I discussed creating a custom data collector based off of one of the SQL Server Management Studio (SSMS) canned reports. For Part 2 I will create a SQL Server Reporting Service (SSRS) report that runs off of the Management Data Warehouse (MDW) and queries my custom collector data to build a nice graph of my top tables.
The first thing I needed was a way to connect to my MDW from my reporting server instance. Since I wanted to set up my report to be an email subscription, which means I had to have stored credentials on my SSRS server. I created a new custom sql login on my SQL Server instance where my MDW database lived. I gave it read-only or db_datareader role on that database and then verified it and then started working on the queries I wanted to run.
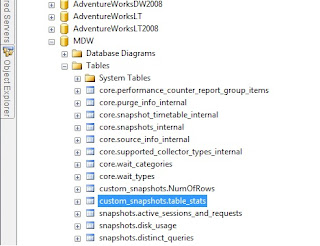
In the previous post I created a new collector that created a table with stats for all the tables in my database. If I look in my MDW database I now have a new table under the custom_snapshots schema with data from my new collector.
The table now has the basic stats for the database tables being monitored. Including Schema,tablename,row_count,reserved,data,index_size, unused, the collection_time and snapshot_id (this gets incremented every time the collector runs so you can distinctly identify collections).
The following query will give me a snapshot of the top ten tables as of the last collection time.
select top 10 tablename,row_count FROM [MDW].[custom_snapshots].[table_stats] Where databasename='AdventureWorksDW2008' AND snapshot_id = (select MAX(snapshot_id) from [MDW].[custom_snapshots].[table_stats] ) order by row_count desc |
Switching gears I can now open up BIDS and create a new reporting services project. You can use the wizard if you so choose or add things manually, I won't show that here but there are plenty of sites on how to get started with SSRS. For this example I want a chart, see here for a good tutorial Tutorial: Adding a Bar Chart to a Report (Report Designer).
Next in Business Intelligence Studio (BIDS) create a new project for your MDW Reports.
Whether using the wizard or creating datasource, datasets, and reports separately the key is that I will need all three for this example. (hint: the wizard will step you through creating these three things in case you get confused).
For my datasource I want to use the readonly account I created and granted access to my MDW database earlier.
Next I create a new dataset against that datasource with my query see above.
Now I need a new report (in this case I did not use the wizard). Once I have my report area visible in design view I can add a chart. I chose Bar chart for this example.
Fill in the chart data with the appropriate columns from your data set.
I added enable scale breaks to the horizontal axis since a few tables are much larger than others so it looks nicer.
Lastly I preview the report to make sure it looks right.
Now I can deploy it to my SSRS server if I want. Once there I can setup a subscription to email the report to whomever I want on whatever schedule I want. For my final report in my case I wanted a weekly report that showed table growth over time. So I had to adjust the query and chart accordingly. It now looks like this one except or course mine has numbers and labels on it.


No comments:
Post a Comment