Friday, March 4, 2011

Creating Custom Data Collectors SQL Server 2008 R2 Part 2 SSRS


In Part 1 I discussed creating a custom data collector based off of one of the SQL Server Management Studio (SSMS) canned reports. For Part 2 I will create a SQL Server Reporting Service (SSRS) report that runs off of the Management Data Warehouse (MDW) and queries my custom collector data to build a nice graph of my top tables.

The first thing I needed was a way to connect to my MDW from my reporting server instance. Since I wanted to set up my report to be an email subscription, which means I had to have stored credentials on my SSRS server. I created a new custom sql login on my SQL Server instance where my MDW database lived. I gave it read-only or db_datareader role on that database and then verified it and then started working on the queries I wanted to run.

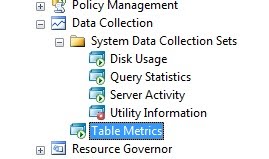
In the previous post I created a new collector that created a table with stats for all the tables in my database. If I look in my MDW database I now have a new table under the custom_snapshots schema with data from my new collector.


The table now has the basic stats for the database tables being monitored. Including Schema,tablename,row_count,reserved,data,index_size, unused, the collection_time and snapshot_id (this gets incremented every time the collector runs so you can distinctly identify collections).


The following query will give me a snapshot of the top ten tables as of the last collection time.

select top 10 tablename,row_count FROM [MDW].[custom_snapshots].[table_stats] Where
databasename='AdventureWorksDW2008' AND snapshot_id = (select MAX(snapshot_id) from
[MDW].[custom_snapshots].[table_stats] ) order by row_count desc

Switching gears I can now open up BIDS and create a new reporting services project. You can use the wizard if you so choose or add things manually, I won't show that here but there are plenty of sites on how to get started with SSRS. For this example I want a chart, see here for a good tutorial Tutorial: Adding a Bar Chart to a Report (Report Designer).

Next in Business Intelligence Studio (BIDS) create a new project for your MDW Reports.


Whether using the wizard or creating datasource, datasets, and reports separately the key is that I will need all three for this example. (hint: the wizard will step you through creating these three things in case you get confused).
For my datasource I want to use the readonly account I created and granted access to my MDW database earlier.


Next I create a new dataset against that datasource with my query see above.


Now I need a new report (in this case I did not use the wizard). Once I have my report area visible in design view I can add a chart. I chose Bar chart for this example.


Fill in the chart data with the appropriate columns from your data set.


I added enable scale breaks to the horizontal axis since a few tables are much larger than others so it looks nicer.


Lastly I preview the report to make sure it looks right.


Now I can deploy it to my SSRS server if I want. Once there I can setup a subscription to email the report to whomever I want on whatever schedule I want. For my final report in my case I wanted a weekly report that showed table growth over time. So I had to adjust the query and chart accordingly. It now looks like this one except or course mine has numbers and labels on it.


Creating Custom Data Collectors SQL Server 2008 R2 Part 1

With the release of SQL 2008 Microsoft introduced the Management Data Warehouse and Data Collection. This feature is a fantastic tool for DBAs and System Administrators who need to not only monitor and track system performance but also quickly troubleshoot current issues by comparing active metrics with historic metrics. It is also a very handy resource for being able to report on for management.

There are several canned reports that come with the Management Data Warehouse (MDW) in addition to the canned reports that come with SQL Server Management Studio (SSMS). However there is a lot more data and functionality in the MDW than the handful of canned reports may initially lead you to believe.

The best thing to do in my opinion, if you haven't used any of these features before is to setup a development box for your first implementation of MDW and play with it for awhile before introducing it into your environment. The default collectors keep a lot of data and the database can grow quickly also if you have lots of systems collecting to the same warehouse you can see performance issues if they all try to collect and upload at the same time.

One of the coolest things about Data Collectors and MDW is the ability to create your own Custom collectors. So how to tie this all together. Well I really like the Disk Usage by Top Tables report that comes canned in SSMS.

However I really want to be able to see this data every day over time. Also, my management would like to know how fast our system is growing and how much data we are adding. The solution....?

Well what I can do is first trace the code that runs behind the SSMS report Disk Usage by Top Tables. Once I have that query I tweak it a bit to work in the confines of the collector definition. See a couple of good links here:
http://msdn.microsoft.com/en-us/library/bb677277.aspx

http://www.sql-server-performance.com/2008/system-data-collection-reports-install/


Now I can use the T-SQL from the report to be the basis for my new custom collector, essentially running that report and storing the data over time on whatever schedule I choose. You can tweak the collection frequency, caching and uploading jobs either now or after the collector is created. Also, if you want it to be for one or many databases can be configured. Once it is created be sure to enable it and verify that the new custom_snapshots table appears in your MDW.


Begin Transaction
Begin Try
Declare @collection_set_id_1 int
Declare @collection_set_uid_2 uniqueidentifier
EXEC [msdb].[dbo].[sp_syscollector_create_collection_set] @name=N'Table Metrics', @collection_mode=1, @description=N'Collects data about the table stats.', @logging_level=0, @days_until_expiration=730, @schedule_name=N'CollectorSchedule_Every_6h', @collection_set_id=@collection_set_id_1 OUTPUT, @collection_set_uid=@collection_set_uid_2 OUTPUT
Select @collection_set_id_1, @collection_set_uid_2

Declare @collector_type_uid_3 uniqueidentifier
Select @collector_type_uid_3 = collector_type_uid From [msdb].[dbo].[syscollector_collector_types] Where name = N'Generic T-SQL Query Collector Type';
Declare @collection_item_id_4 int
EXEC [msdb].[dbo].[sp_syscollector_create_collection_item] @name=N'Table_Stats', @parameters=N'

SELECT
a3.name AS schemaname,
a2.name AS tablename,
DB_NAME() AS databasename,
a1.rows as row_count,
(a1.reserved + ISNULL(a4.reserved,0))* 8 AS reserved,
a1.data * 8 AS data,
(CASE WHEN (a1.used + ISNULL(a4.used,0)) > a1.data THEN (a1.used + ISNULL(a4.used,0)) - a1.data ELSE 0 END) * 8 AS index_size,
(CASE WHEN (a1.reserved + ISNULL(a4.reserved,0)) > a1.used THEN (a1.reserved + ISNULL(a4.reserved,0)) - a1.used ELSE 0 END) * 8 AS unused
FROM
(SELECT
ps.object_id,
SUM (
CASE
WHEN (ps.index_id < 2) THEN row_count
ELSE 0
END
) AS rows,
SUM (ps.reserved_page_count) AS reserved,
SUM (
CASE
WHEN (ps.index_id < 2) THEN (ps.in_row_data_page_count + ps.lob_used_page_count + ps.row_overflow_used_page_count)
ELSE (ps.lob_used_page_count + ps.row_overflow_used_page_count)
END
) AS data,
SUM (ps.used_page_count) AS used
FROM sys.dm_db_partition_stats ps
GROUP BY ps.object_id) AS a1
LEFT OUTER JOIN
(SELECT
it.parent_id,
SUM(ps.reserved_page_count) AS reserved,
SUM(ps.used_page_count) AS used
FROM sys.dm_db_partition_stats ps
INNER JOIN sys.internal_tables it ON (it.object_id = ps.object_id)
WHERE it.internal_type IN (202,204)
GROUP BY it.parent_id) AS a4 ON (a4.parent_id = a1.object_id)
INNER JOIN sys.all_objects a2 ON ( a1.object_id = a2.object_id )
INNER JOIN sys.schemas a3 ON (a2.schema_id = a3.schema_id)
WHERE a2.type != N''S'' and a2.type != N''IT''
table_stats
MY_OLTP_DB
', @collection_item_id=@collection_item_id_4 OUTPUT, @frequency=60, @collection_set_id=@collection_set_id_1, @collector_type_uid=@collector_type_uid_3
Select @collection_item_id_4

Commit Transaction;
End Try
Begin Catch
Rollback Transaction;
DECLARE @ErrorMessage NVARCHAR(4000);
DECLARE @ErrorSeverity INT;
DECLARE @ErrorState INT;
DECLARE @ErrorNumber INT;
DECLARE @ErrorLine INT;
DECLARE @ErrorProcedure NVARCHAR(200);
SELECT @ErrorLine = ERROR_LINE(),
@ErrorSeverity = ERROR_SEVERITY(),
@ErrorState = ERROR_STATE(),
@ErrorNumber = ERROR_NUMBER(),
@ErrorMessage = ERROR_MESSAGE(),
@ErrorProcedure = ISNULL(ERROR_PROCEDURE(), '-');
RAISERROR (14684, @ErrorSeverity, 1 , @ErrorNumber, @ErrorSeverity, @ErrorState, @ErrorProcedure, @ErrorLine, @ErrorMessage);

End Catch;

GO


Ok so Part 1 was a little long, so I am breaking this up in two parts. For part 2 I'll go over the SSRS report that sends management a weekly email showing top table growth.